Figure 6.
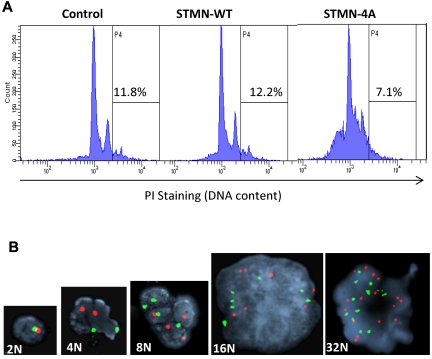
Evaluation of MK ploidy. (A) Representative examples of DNA histograms obtained by flow cytometric analysis of propidium iodide-stained MKs grown in the presence of control and stathmin-expressing lentiviruses (STMN-WT and STMN-4A). The percentages of polyploid cells with more than 4N DNA content are indicated in each condition within the gate P4. (B) FISH analysis of MKs generated in the same conditions. MKs cytospun on slides, fixed, and labeled with Spectrum Orange and Spectrum Green-conjugated probes were visualized by fluorescence microscopy to identify X (red fluorescence) and Y (green fluorescence) chromosomes, respectively. The slides were counterstained with 4,6-diamidino-2-phenylindole to visualize nuclear morphology. One copy of each X and Y chromosome indicates 2N DNA content, 2 copies of each chromosome indicates 4N, 4 copies indicates 8N, and so on. As illustrated, the increase in ploidy is accompanied by an increase in nuclear size and complexity (ie, polylobulation).

