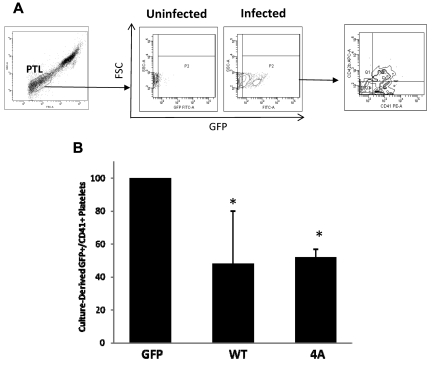
Figure 7.
Flow cytometric analysis of platelets derived in culture from MKs infected with control and stathmin-expressing lentiviruses. (A) The dot plot on the left shows the analytic gate containing culture-derived platelets (PTL). This gate was set based on the forward and side scatter light properties of human PB platelets, as described in “Analysis of culture-derived platelets.” The density plots in the middle represent platelets derived from uninfected MKs used as negative control for GFP expression and platelets derived from lentivirus-infected MKs showing GFP expression (x-axis). The density plot on the right represents GFP+ culture-derived platelets showing CD41 expression (x-axis) and CD42b expression (y-axis). (B) Quantification of platelets derived from MKs infected with control (GFP), wild-type (WT), or nonphosphorylatable mutant (4A) stathmin-expressing lentiviruses. The results are represented as fold change in the percentage plus or minus SD of GFP+/CD41+ platelets in 3 independent experiments.

