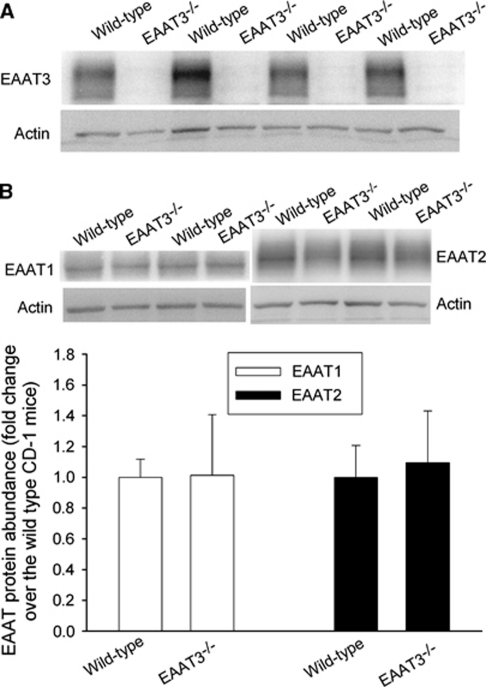
Figure 1.
The expression of glutamate transporters (EAATs) in mouse brains. The results of EAAT3 are presented in A, and the results of EAAT1 and EAAT2 are shown in B. In panel B, a representative western blot is shown in the top panel, and the graphic presentation of EAAT protein abundance quantified by integrating the volume of autoradiograms from six CD-1 wild-type mice and six EAAT3 knockout mice is shown in the bottom panel. Values in graphs are expressed as fold change over the CD-1 wild-type mice and presented as means±s.d. EAAT, excitatory amino-acid transporter.

