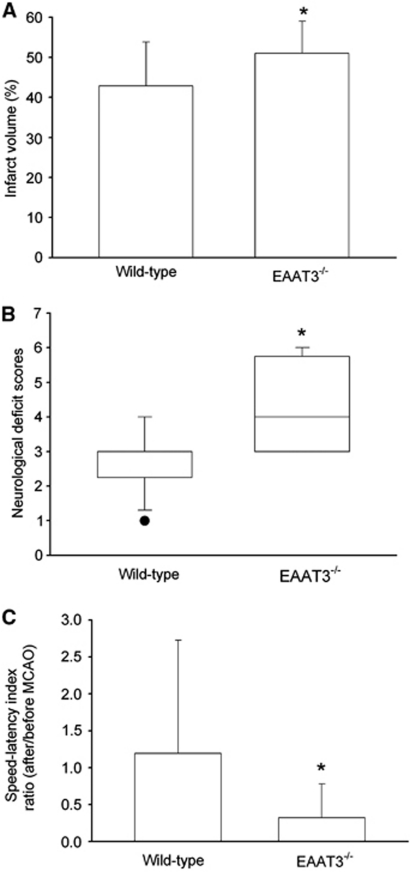
Figure 3.
Neurologic outcome at 24 hours after focal brain ischemia. (A) Percentage of infarct volume in ipsilateral hemisphere volume. Results are means±s.d. (n=12). (B) Neurologic deficit scores evaluated immediately before animals were killed for the assessment of infarct sizes (data are presented in panel A). Results are presented in a box plot format (n=12). •: Lowest or highest score (the score will not show up if it falls in the 95% interval); between lines: 95% interval of the data; inside boxes: 25% to 75% interval including the median of the data. (C) Performance on rotarod. Mice were tested before and 24 hours after MCAO and the speed–latency index ratio of these two tests is presented. The speed–latency index before MCAO was 2,890±2,941 r.p.m. seconds and 3,178±1,866 r.p.m. seconds (P=0.76), respectively, for wild-type CD-1 mice and EAAT3 knockout mice. Results are means±s.d. (n=12). *P<0.05 compared with wild-type CD-1 mice. EAAT, excitatory amino-acid transporter; MCAO, middle cerebral artery occlusion.

