
Figure 2.
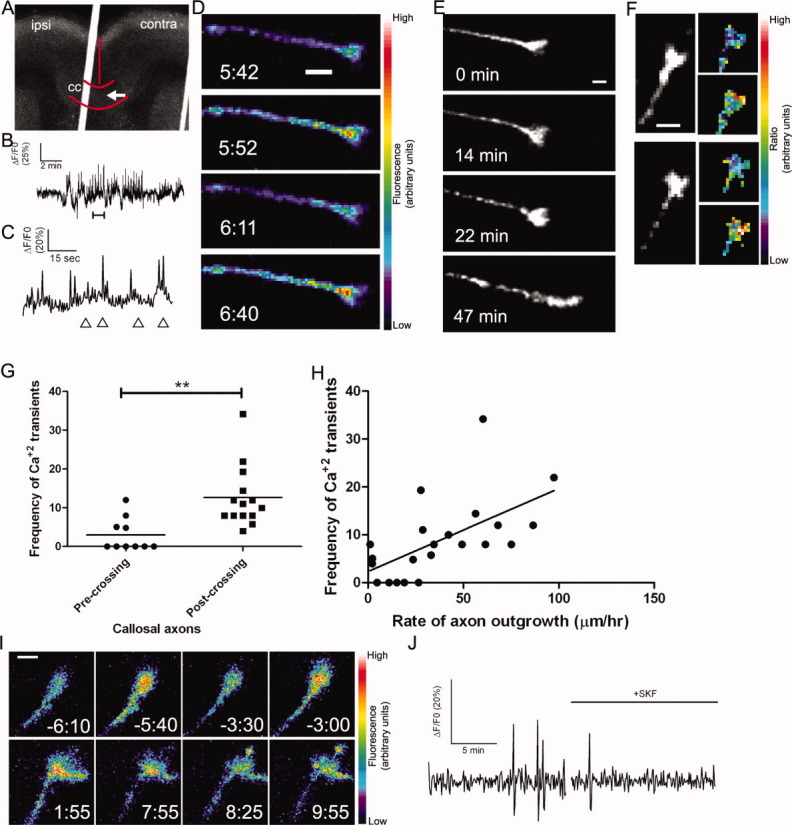
Callosal axons express spontaneous calcium transients that are correlated with rates of axon outgrowth. (A) A coronal cortical slice in which plasmids encoding GCaMP2 were injected and electroporated into the left cortex (ipsi). The arrow indicates the position of the growth cone imaged in B–D, which had crossed the midline. Red curves indicate the borders of the corpus callosum (cc) and the midline. The white line is autofluorescence from the slice holder used in live cell imaging. (B) Tracing of calcium activity measured by the change in GCaMP2 fluorescence over baseline. Calcium activity increases after a few minutes of imaging. (C) Tracing of calcium activity from (B) zoomed in to the time period indicated by the bracket (B, bottom). (D) Fluorescence images of the growth cone from (B–C) at the time points indicated by arrowheads in (C). (E) Within 20 min of the onset of calcium activity shown in (B) the axon begins to rapidly advance through the contralateral callosum. (F) Examples of single calcium transients measured by ratiometric imaging in growth cones coexpressing DsRed2 and GCaMP2. (G) Plot of frequencies of calcium transients in pre-crossing or post-crossing callosal axons. **p < 0.01, t test. All frequencies in units of transients h−1. (H) Scatter plot of the frequency of calcium transients versus the rate of axon outgrowth in individual callosal axons. The line represents the least-squares linear regression (slope significantly non-zero, p < 0.01). (I) An example of spontaneous calcium transients (top row) which are attenuated by application of SKF (time 0:00, bottom rows). (J) Tracing of calcium activity in the growth cone shown in (I) before and after application of SKF. Scale bars, 10 μm except I, which is 5 μm. Pseudocolor calibration bars indicate fluorescence intensity (D) or ratio of GCaMP2 to DsRed2 fluorescence intensities (F) in arbitrary units.