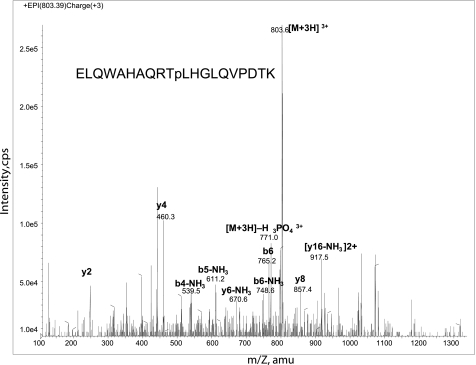
FIGURE 1.
Mass spectrometric analysis of PMA2 phosphopeptides. An analysis of a phosphopeptide from purified His-tagged PMA2 expressed in the N. tabacum BY2 cell line is shown. The product ion spectrum of m/z 803.4 (3+) identifies the peptide as mono-phosphorylated ELQWAHAQRTpLHGLQVPDTK and pinpoints threonine 889 as the site of phosphorylation. Intensity is in cps. amu, atomic mass units.

