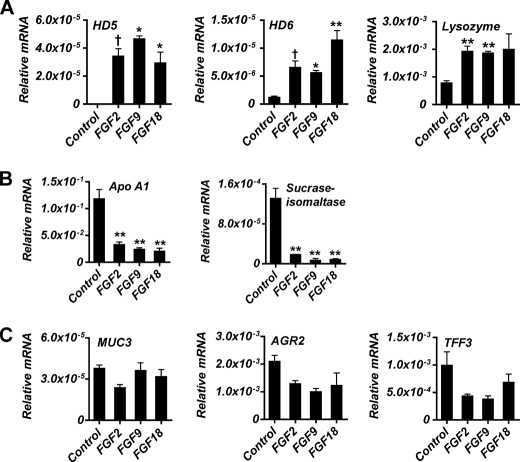
FIGURE 1.
Expression of intestinal lineage differentiation markers by Caco2 cells in response to FGF stimulation. A, Paneth cell markers: HD5 and HD6 and lysozyme. B, enterocyte cell markers: apoA1 and sucrase-isomaltase. C, goblet cell markers: MUC3, AGR2, and TFF3. Caco2 cells were treated with FGF9 (50 ng/ml), FGF2 (10 ng/ml), or FGF18 (50 ng/ml) daily beginning at 24 h postplating until cells were harvested at confluence. Control cells were not treated. mRNA levels were determined by quantitative real-time PCR. Values (mean ± S.D. (error bars)) are expressed relative to 18 S rRNA. †, p ≤ 0.05; *, p ≤ 0.01; **, p ≤ 0.001.

