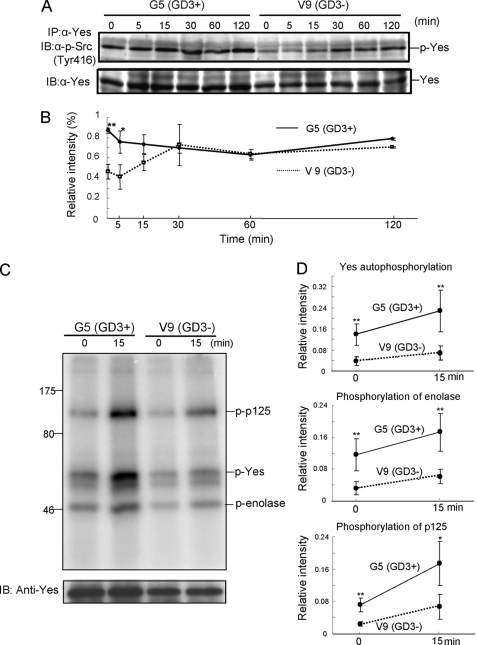
FIGURE 4.
Tyrosine phosphorylation of Yes at Tyr-416 by FCS treatment. A, G5 (GD3+) and V9 (GD3−) were treated with FCS after serum starvation for 12 h, and Yes was immunoprecipitated (IP) from their lysates at the indicated time points. Then tyrosine phosphorylation of Yes at Tyr-416 was analyzed by an anti-phospho-Src family (Tyr-416) antibody. IB, immunoblotting. B, the relative intensity of bands of p-Yes in A was measured using National Institutes of Health Image 1.61 and plotted after correction with that of Yes. The experiments were performed in triplicates, and mean ± S.D. are presented. *, p < 0.05; **, p < 0.01. C, kinase activity of Yes under GD3 expression. An in vitro kinase assay was done with enolase as a substrate to determine whether GD3 enhances the kinase activity of Yes. G5 (GD3+) and V9 (GD3−) were treated with FCS after serum starvation for 12 h, and Yes was immunoprecipitated from their lysates. Then, an in vitro kinase assay was performed using 3 μg of enolase and 1 μm ATP. D, the relative intensity of bands in C was measured using National Institutes of Health Image 1.61 and plotted after correction with those of Yes. The experiments were performed in triplicates, and mean ± S.D. are presented. *, p < 0.05; **, p < 0.01. Note that the bands of autophosphorylated Yes, phosphorylated p125, and phosphorylated enolase were stronger in GD3+ cells than those in GD3− cells at both 0 min and 15 min after FCS treatment.

