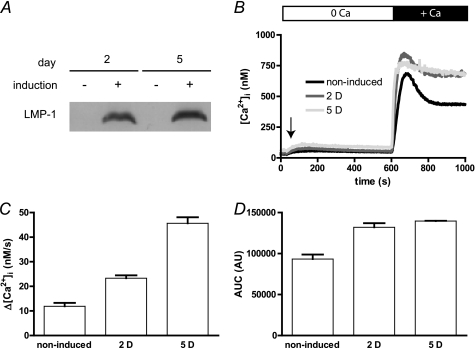
FIGURE 4.
EBV LMP-1 increases [Ca2+]cyt variations in BJAB cells. Expression of LMP-1 was tested by Western blot as described in the legend to Fig. 1. Calcium measurements were performed as described in the legend to Fig. 2. BJAB-tTa-LMP1 cells were grown in presence of tetracycline to repress LMP1 expression (induction −) or in the absence of tetracycline to allow LMP1 expression for up to 5 days (induction +). A, expression of LMP-1 after 2 (2 D) and 5 (5 D) days of induction. B, [Ca2+]i of noninduced cells or after 2 and 5 days of LMP-1 expression induction were measured as described in the legend to Fig. 2. Day 1 experiment was omitted as the Δ[Ca2+]cyt was not different to the control Δ[Ca2+]cyt. Day 3 and 4 experiments were omitted as the Δ[Ca2+]cyt levels were not different to the day 5 Δ[Ca2+]cyt. C, the Ca2+ influx rate was estimated as the slope of the Δ[Ca2+]cyt during the first 20 s. D, the area under the curve was calculated as the sum of [Ca2+]cyt during 400 s after CaCl2 addition. AUC, area under curve; AU, arbitrary units.

