FIGURE 2.
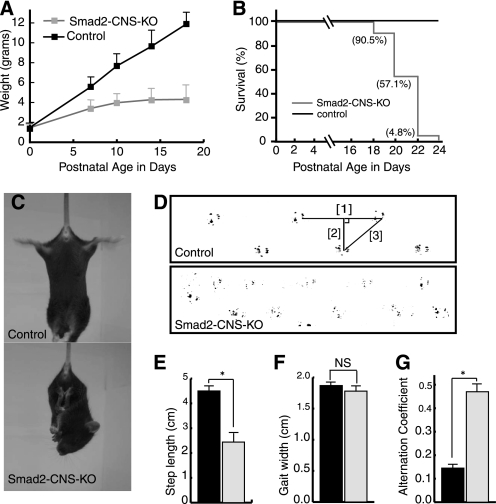
Growth retardation and cerebellar ataxia in Smad2-CNS-KO mice. A, Smad2-CNS-KO mice showed growth retardation. Smad2-CNS-KO mice could not gain weight after P5. The diagram compares the body weights of control and Smad2-CNS-KO mice over postnatal development (n = 5). Error bars indicate S.D. B, survival curves for Smad2-CNS-KO (n = 21) mice and control mice (n = 19). 100% of Smad2-CNS-KO mice died at 24 days of age, whereas no control mice died. C, in the tail suspension test, the Smad2-CNS-KO mice often crossed or clasped their hind limbs, whereas wild-type mice usually extended and shook their hind limbs. D, representative footprint patterns. The ink footprint illustrates the broad-based gait of the hind limbs of control and Smad2-CNS-KO mice at P18. E–G, footprint patterns were quantitatively assessed for step length (E), gait width (F), and step alternation uniformity (G) as described under “Experimental Procedures.” Smad2-CNS-KO mice displayed significantly higher irregularity in step alternation than wild-type controls (alternation coefficient 0.47 ± 0.3 versus 0.15 ± 0.02, n = 3). Black and gray bars represent control and Smad2-CNS-KO, respectively (n = 5).

