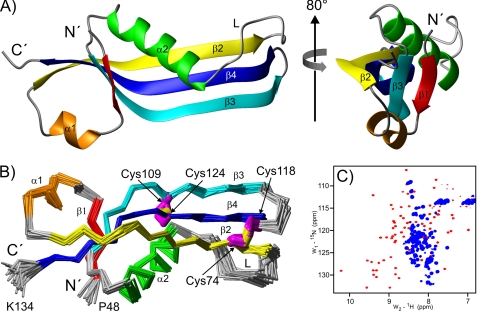
FIGURE 3.
Structure of the RcsF-Δ30 oxidized monomeric form. A, ribbon diagram representing the RcsF-Δ30 structure. The structure on the right was obtained by 80° rotation around the indicated axis. The unstructured residues 30–47 are not included. B, Cα traces of the final RcsF-Δ30 structural ensemble of 25 conformers. The indicated cysteine side-chains are marked in magenta and the -S–S- bridge in yellow. The structure was obtained from the one shown in A by 180° rotation around the x axis. C, RcsF-Δ30 [15N,1H]HSQC-TROSY spectrum under oxidizing conditions (red contours) and after reduction (blue contours).

