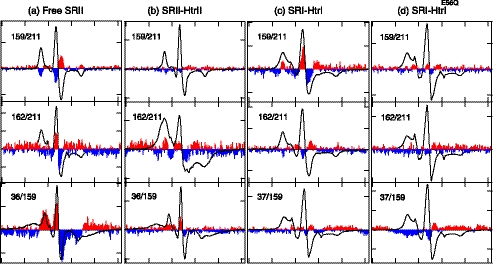
FIGURE 6.
EPR spectra of spin probes doubly labeled at the indicated two positions in the photoreceptors. a, free SRII; b, SRII in complex with HtrII157; c, SRI in complex with HtrI147; and d, SRI in complex with HtrI147 with the E56Q mutation. EPR spectra measured in the dark are shown with black solid lines. The light-minus-dark difference spectra subtracting the dark spectra from those measured during the illumination with 500 nm of light for SRII and >520 nm of light for SRI are appended with 10-fold magnification to each panel with the positive and the negative peaks filled with red and blue, respectively. The width of the abscissa axis in each of the panels represents 150 G.

