FIGURE 4.
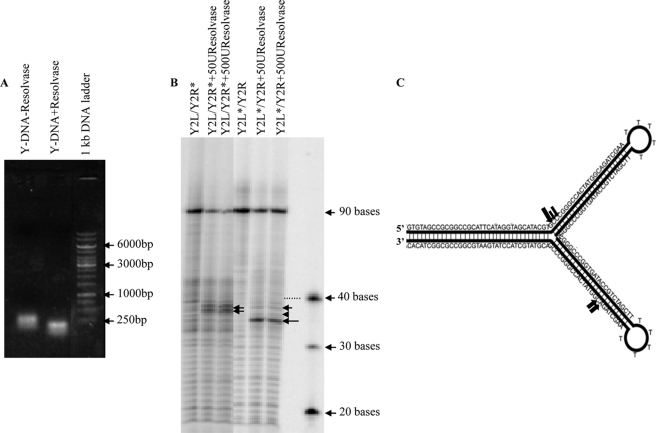
T4 Endo VII resolves the Y-DNA structure. A, gel mobility shift assays were carried out with and without resolvase treatment of the Y-DNA, and samples were analyzed on agarose gel. Molecular weight markers are indicated by arrows. B, for the analysis of cleavage sites at the nucleotide level in Y-DNA structures, either strand of the Y-DNA (Y2L/Y2R) was 5′ end-labeled with [γ-32P]ATP and hybridized with unlabeled complementary strand. The Y-DNAs with labeled Y2R strand (Y2L/Y2R*) and with labeled Y2L strand (Y2L*/Y2R) were treated with 50 and 500 units of resolvase and were run along with the untreated Y-DNA samples after boiling on 8% denaturing polyacrylamide gel and were visualized by autoradiography. The markers are shown with arrows with the number of bases indicated. The dotted line shows the DNA band corresponding to the 40-base marker. C, schematic representation of the Y-DNA sequence showing resolvase cleavage sites. The cleavage sites are represented by filled arrows of varying sizes to illustrate the differences in cutting efficiencies.

