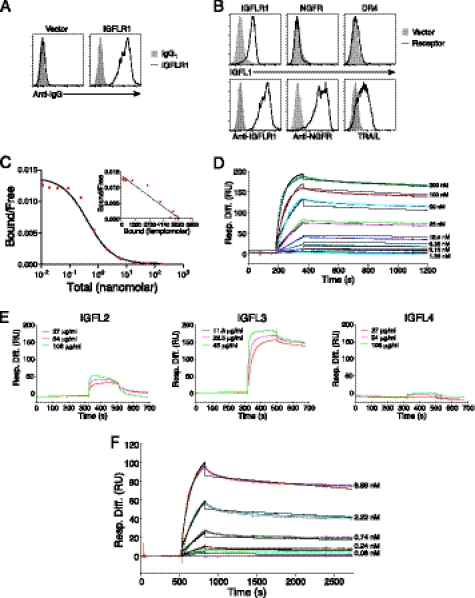
FIGURE 4.
IGFL1 interacts with human IGFLR1 with high affinity. A, monoclonal anti-IGFLR1 binds to cells transfected with IGFLR1. HEK293T cells were transfected with IGFLR1 or vector and later stained with anti-IGFLR1 or control antibody. B, shown is FACS analysis of IFGL1 binding to cells expressing surface IGFLR1. HEK293T cells transfected control vector, or the indicated receptors were incubated with FLAG-IGFL1, and binding was demonstrated with fluorescently labeled anti-FLAG. NGFR expression was determined using a phycoerythrin-labeled anti-NGFR antibody, and DR4 expression was detected with soluble FLAG-TRAIL and anti-FLAG. C, a radioligand assay was used to determine the affinity of IGFL1 with IGFLR1. I125-labeled FLAG-IGFL1 was allowed to bind to HEK293T cells transfected with human IGFLR1 with increasing amounts of unlabeled ligand. Graphs are representative of two experiments. D, sensograms of FLAG-IGFL1 binding to immobilized IGFLR1-Fc analyzed by SPR (χ2 = 49.2) are shown. E, shown are sensograms of the indicated concentrations of FLAG-IGFL2, FLAG-IGFL3, and FLAG-IGFL4 binding to 7145 response units of immobilized IGFLR1-Fc. F, sensograms of FLAG-IGFL3 binding to immobilized IGFLR1-Fc analyzed by SPR (χ2 = 3.5) are shown. Black lines on D and F represent the fit to the data (colored lines). Response difference (Resp. Diff.) relative to a control reference flow cell is given in response units (RU).

