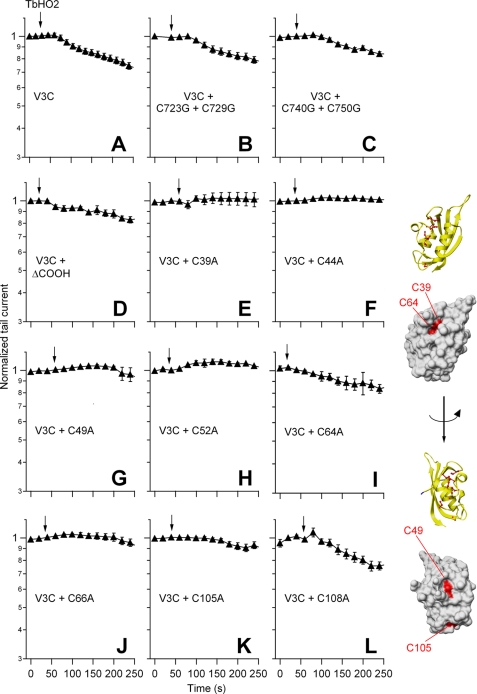
FIGURE 2.
Effect of TbHO2 on V3C mutant channels in the presence or absence of endogenous cysteine residues. The time course of normalized peak tail current variation after perfusion of 2 mm TbHO2 (arrows) is shown. The identity of the single-, double-, and triple-mutant channel constructs is indicated in A–C and E–L. Data corresponding to a construct in which mutation V3C was combined with a C-terminal deletion removing residues 864–1010 (V3CΔCOOH) are shown in D. Averaged data from 5–10 oocytes are shown. Ribbon and surface representations of a single hERG eag/PAS domain corresponding to the x-ray tridimensional structure from Morais Cabral et al. (28) are shown on the right. The eight cysteines present in this channel region are shown in ball-and-stick representation in the ribbon diagrams. The positions of the four cysteine side chains (residues 39, 49, 64, and 105) that show up on the surface of the domain are highlighted in red. Note that the initial 26 residues of the hERG sequence not ordered in the crystal structure do not appear in the diagrams. Molecular graphic images were produced using the UCSF Chimera package from the Resource for Biocomputing, Visualization, and Informatics at the University of California, San Francisco.

