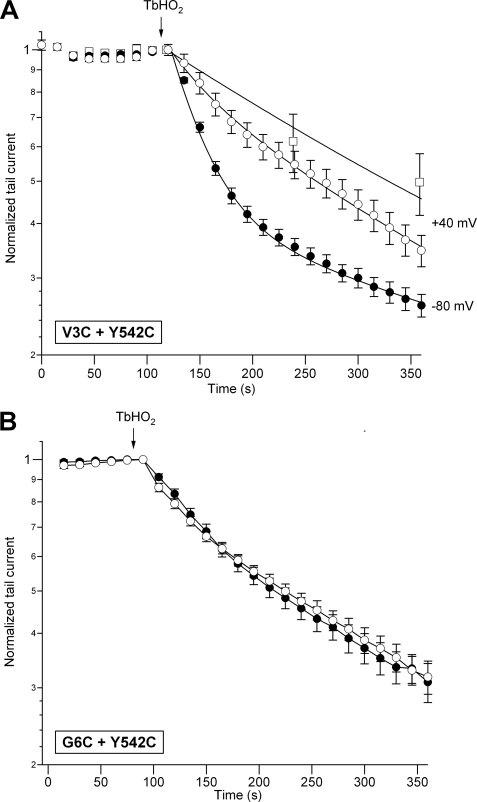
FIGURE 6.
State dependence of the TbHO2-induced effect. A, time course of V3C/Y542C peak tail current variation in response to TbHO2. Peak tail currents were measured as described in the legend to Fig. 1 during repolarization steps applied at the indicated intervals from holding potentials of −80 mV (●) and +40 mV (○ and □). The magnitude of the peak tail currents was estimated at 15-s intervals (● and ○) or without continuous pulsing (□). The continuous lines correspond to exponential curves that best fit the data. Long treatments with the oxidizing agent were used to fit the data at +40 mV, but only data during the initial period of recording are shown for clarity. B, independence of the TbHO2-induced effect on the conformational state of the G6C/Y542C channel. Channels were held closed at −80 mV (●) or open/inactivated at +40 mV (○) during the application of TbHO2 as indicated in A. Note that, in this case, the inhibition kinetics superimpose onto the slow time course observed with V3C/Y542C channels held at +40 mV.

