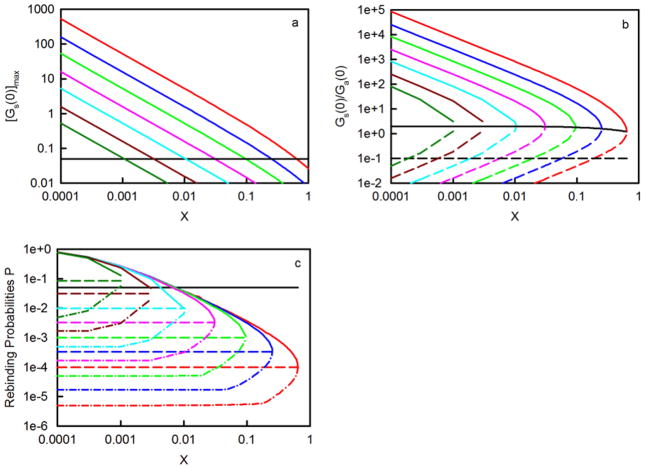
Figure 4. Conditions Required for TIR-FCS.
In all panels, the colors denote (red) K = 107 M−1; (blue) K = 3 × 10⁶ M−1; (green) K = 106 M−1; (pink) K = 3 × 10⁵ M−1; (cyan) K = 105 M−1; (dark red) K = 3 × 10⁴ M−1; and (dark green) K = 104 M−1. Panel (a) shows the values of [Gs(0)]max calculated from Eq. 14 and as a function of X. In these plots, S = Smax (Eq. 13 and Table 3). The black line depicts the cutoff values of X for which Gs(0) ≤ 0.05 and criterion C is not satisfied. Panel (b) shows the values of Gs(0)/Ga(0) calculated from Eq. 17 and as a function of X. Solid, colored lines are for S = S2 and dashed, colored lines are for S = S1. The solid black line is for S = Smax and does not depend on K. The dashed black line shows the cutoff value below which the ratio is unacceptable according to criterion D. Panel (c) shows P calculated by numerically integrating Eq. 19 with Eq. 20. The value of ka is taken to equal 106 M−1s−1 and the values of S are (solid) S2; (dash) Smax; and (dash-dot) the maximum of S1 and S3. The black line depicts the cut-off value for which P ≥ 0.05 and criterion E is not satisfied.

