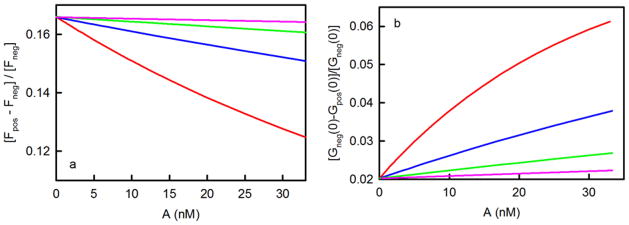
Figure 5. Measurement of K by using TIR-FCS.
In both panels, the colors denote (red) K = 107 M−1, (blue) K = 3 × 10⁶ M−1, (green) K = 106 M−1, and (pink) K = 3 × 10⁵ M−1; surface site densities are (red) 1, (blue) 3.33, (green) 10, and (pink) 33.3 molecules/μm2; and ρ = 0.166. Panel (a) shows the values of [Fpos(A)-Fneg(A)]/Fneg(A) calculated from Eq. 22. The intercepts equal ρ. The initial slopes equal −ρK; their magnitudes increase with K. These slopes are indicative of the ability of the proposed strategy to measure K. Panel (b) shows the values of [Gneg(0)-Gpos(0)]/[Gneg(0)] calculated from Eq. 25. The intercepts equal [ρ/(1+ρ)]2. The initial slopes are 2Kρ/(1+ρ)3 and increase with K.

