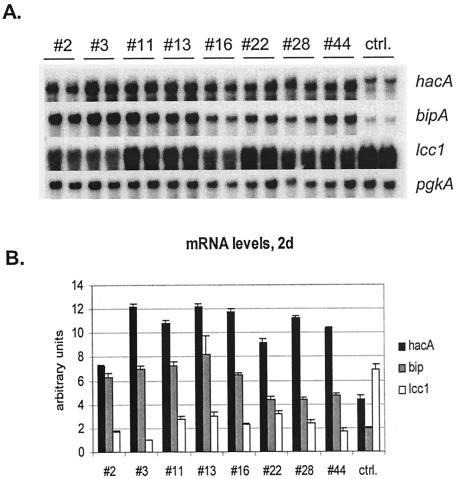
FIG. 3.
(A) Expression levels of hacA, bipA, and the laccase gene lcc1 in the transformants and parental strain (ctrl.). The results of two parallel cultures are shown for each strain. (B) The signal intensities of the Northern blots were quantified and normalized to the pgkA signal intensities. The panels show the averages (±SD) from the two parallel cultures of each strain.

