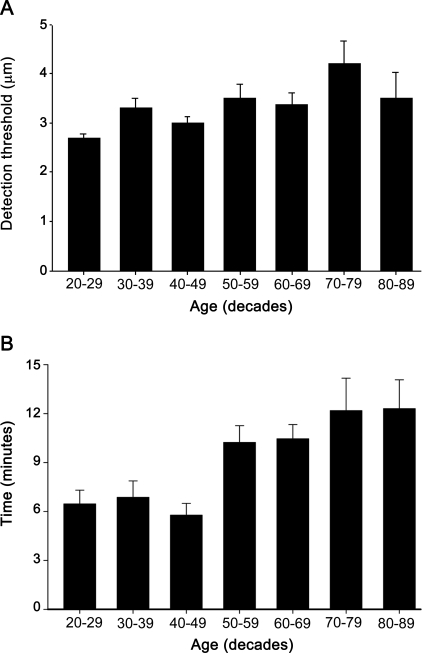
Figure 3. Bump detection thresholds in the control group.
(A) Mean (±SEM) detection thresholds (μm) as a function of age (decades) in control subjects. Mean detection thresholds did not change much with age for subjects between the ages of 20 and 89 years, though linear regression showed that older subjects had a modest tendency to higher thresholds. (B) Time taken to complete the test as a function of age; the 7 decade groups tested different.

