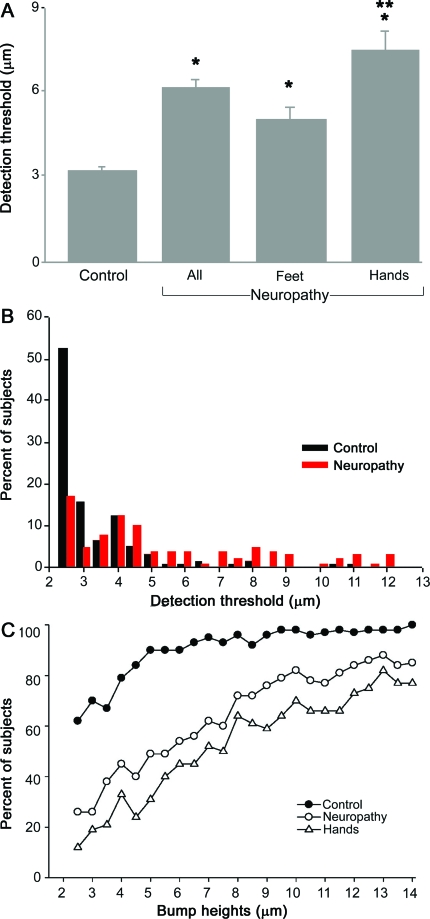
Figure 4. Tactile sensitivity of control and neuropathy subjects using the Bumps test.
(A) Mean (±SEM) bump detection thresholds for all control subjects (control) and all patients (all) with neuropathy. Patients were subdivided according to those with sensory symptoms in the feet only (feet) and those in whom symptoms were also reported in the hands (hands). *Significant difference from control; **significant difference from feet, p < 0.001. (B) The percent of control subjects and patients who exhibited specific bump detection thresholds (μm). A greater proportion of control subjects had thresholds <4 μm whereas a greater proportion of neuropathy patients had thresholds >4 μm. (C) The percent of control subjects (no neuropathy), all neuropathy patients (neuropathy), and the subgroup of patients with sensory symptoms in the hands (hands) that identified individual bumps on their first trial.

