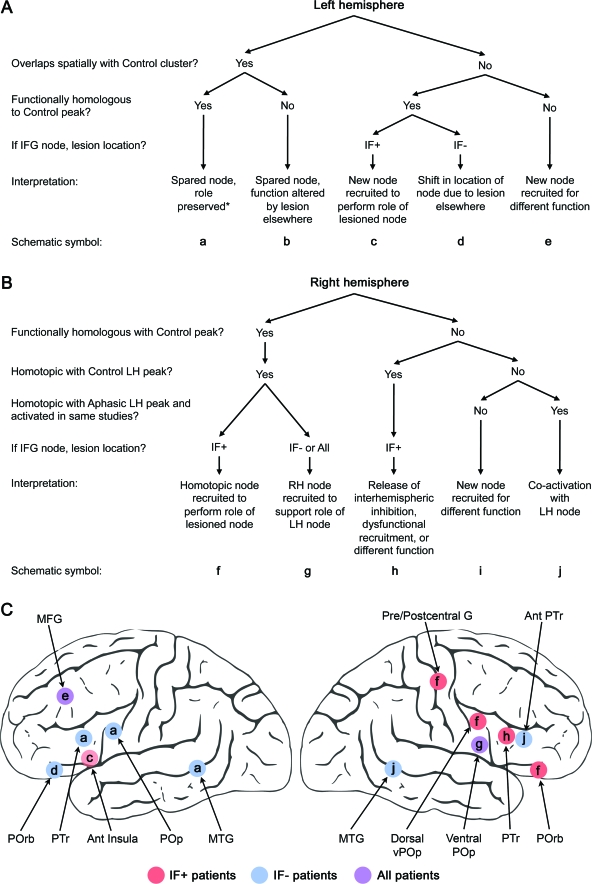
Figure 3. Algorithms used for interpretation and schematics of main results.
Careful consideration of the response properties of areas identified in the aphasia activation likelihood estimation (ALE) analyses suggested reasonable hypotheses regarding the specific adaptive mechanisms to account for the activity. We interpreted the areas identified in the aphasia ALE maps algorithmically based on localization of activity relative to normal control activity, functional homology to corresponding normal control sites, and relationship of activity to lesion location. (A) The algorithm used for left hemisphere (LH) areas. (B) The algorithm used for right hemisphere (RH) areas. (C) Schematics of the main results. Since the right pre/postcentral gyrus activity occurred only in the inferior frontal cortex (IF)+ group, we assumed that the left pre/postcentral gyri were lesioned with the left inferior frontal gyrus (IFG) in most cases (this appeared to be true based on available figures in the papers). If this assumption were false, the correct interpretation would be g. *See Discussion for caveats. MTG=middle temporal gyrus; POp=pars opercularis; POrb=pars orbitalis; PTr=pars triangularis; MFG=middle frontal gyrus.

