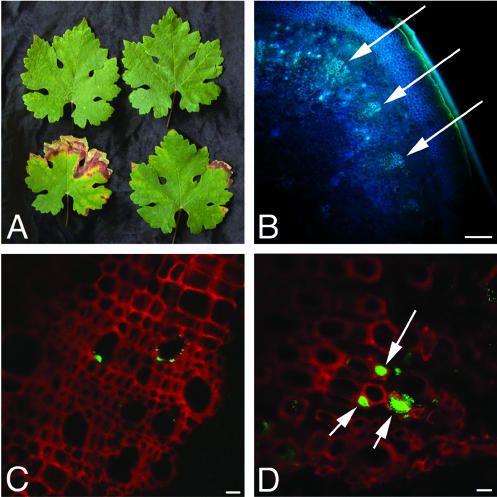
FIG. 1.
Examples of asymptomatic and symptomatic leaves used for analysis. (A) The top row contains asymptomatic leaves; the bottom row contains symptomatic leaves. (B) Low-magnification view of a hand section of a grapevine petiole, similar to those used in the analysis. Arrows indicate the vascular bundles, which are groups of adjacent xylem vessels. (C and D) Representative examples of colonized bundles from an asymptomatic leaf (C) and a symptomatic leaf (D). Plant xylem is depicted in red; X. fastidiosa cells are green. Arrows indicate occluded vessels. Bars, 100 μm (B) and 10 μm (C and D).

