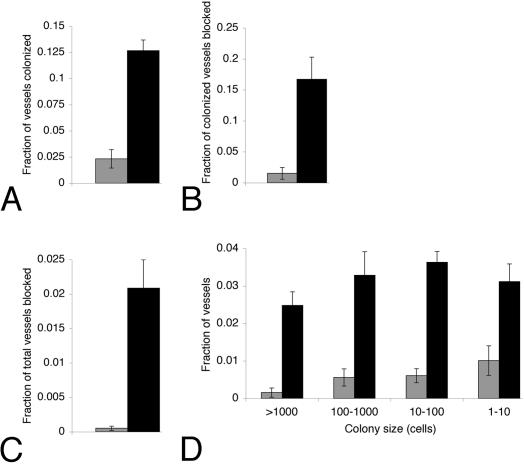
FIG. 5.
Analysis of colonization of vessels in four asymptomatic and four symptomatic leaf petioles, representing 3,784 and 7,963 total vessels, respectively. Gray bars represent asymptomatic leaves; black bars represent symptomatic leaves. (A) Average fraction of vessels per petiole in which colonization was observed in the section examined. (B and C) Average fraction of colonized vessels (B) or total vessels (C) per petiole that were completely plugged by bacteria in the section examined. (D) Colony sizes and average frequency observed per petiole. Note that colony size refers to the number of cells visible in one 0.8- to 1-μm section. Error bars represent the standard error.

