
Figure 3.
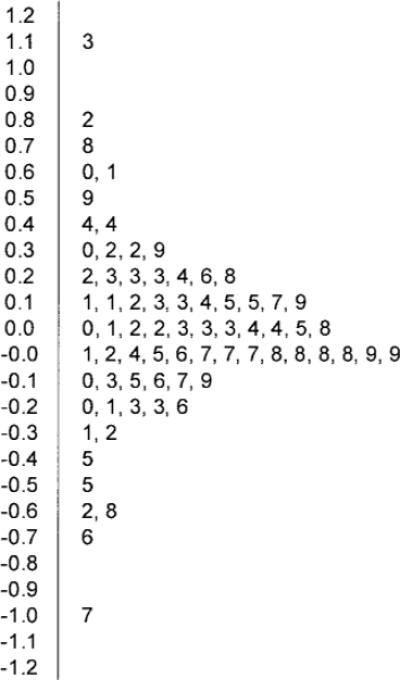
For the discounting-cue conditions, stem-and-leaf plot of weighted effect sizes (ds) representing changes in persuasion from the immediate to the delayed posttest.
Official websites use .gov
A
.gov website belongs to an official
government organization in the United States.
Secure .gov websites use HTTPS
A lock (
) or https:// means you've safely
connected to the .gov website. Share sensitive
information only on official, secure websites.
For the discounting-cue conditions, stem-and-leaf plot of weighted effect sizes (ds) representing changes in persuasion from the immediate to the delayed posttest.