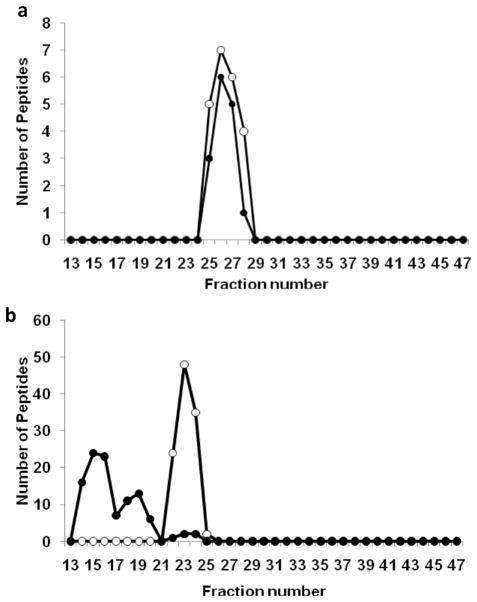
Figure 5.
Examples of elution profile shifts for proteins upon ether delipidation of fresh human plasma. Protein distribution profiles of selected proteins from untreated (○) and ether delipidated plasma (●) after separation by the triple Superdex setup. The distribution of each protein is represented as spectral count per fraction measured by ESI–MS/MS. (a) Plasminogen, which fails to exhibit a molecular size shift in response to ether delipidation and therefore is not associated with lipid, and (b) complement C3 which does shift, indicating an association with lipid. Representative data shown from two independent experiments are shown.

