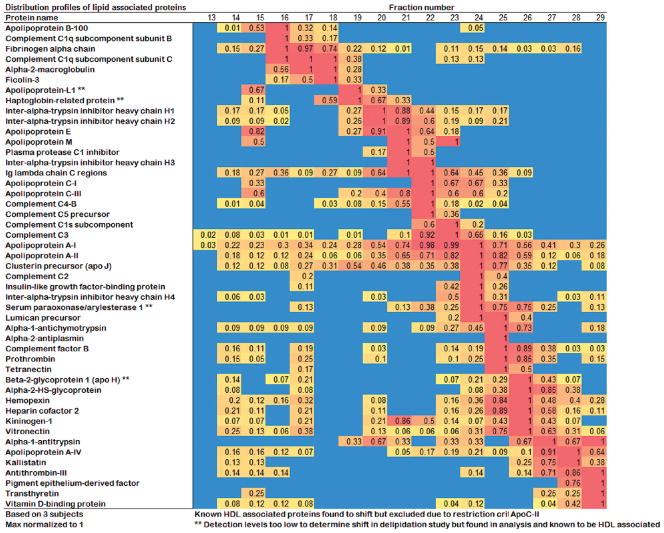
Figure 8.
Triple Superdex distribution profiles for identified lipid-associated proteins. For each fraction, the relative abundance (determined by peptide count) is shown. A value of 1.0 was assigned to the fraction containing the highest peptide count for that particular protein and all other fractions were scaled from there. The relative abundance of each can also be assessed by the color of the square with blue representing 0 detected peptides and red representing the highest number.

