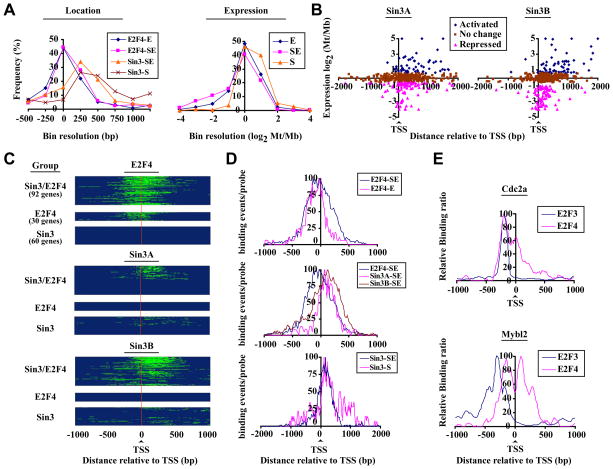
Figure 2. Selective targeting of Sin3 to transcribed regions of differentially expressed groups of genes.
(A) Distribution of E2F4, Sin3A, and Sin3B binding (panel 1) and expression (panel 2) of distinct E2F4 and Sin3 target genes, deduced from promoter array data. Groups represent genes bound by E2F4 (E) or Sin3 (S) only or by both Sin3 and E2F4 (SE). Mb: myoblasts, Mt: myotubes. (B) Location of Sin3 binding (central probe) relative to the TSS was plotted as a function of relative expression during differentiation (Blais and Dynlacht, 2007). Activated: log2 Mt/Mb>0.58, repressed: Mt/Mb < −0.58. (C) Heatmaps of E2F4, Sin3A, and Sin3B binding deduced from tiling array data. Genes were grouped as described for panel A. Probes associated with factor binding are shown in green. A binding event (peak) was defined by a minimum of 3 probes with log2 (IP/Input) > 1, maximally spaced by 80 bp (Fig. S3). The results of three independent experiments are shown. (D) E2F4, Sin3A, and Sin3B binding profiles on genes grouped (as in panel A) according to factor occupancy. For each group, genes were aligned with respect to their TSS. Probes associated with a binding event (as determined by our peak finding algorithms) were set to 1, while all others were set to 0. The total number of binding events for all genes per group per probe was calculated, normalized for maximum binding, and plotted relative to the TSS. (E) Binding profiles for E2F3b and E2F4 on genes bound by E2F4 (Cdc2a) or by E2F4 and Sin3 (Mybl2).

