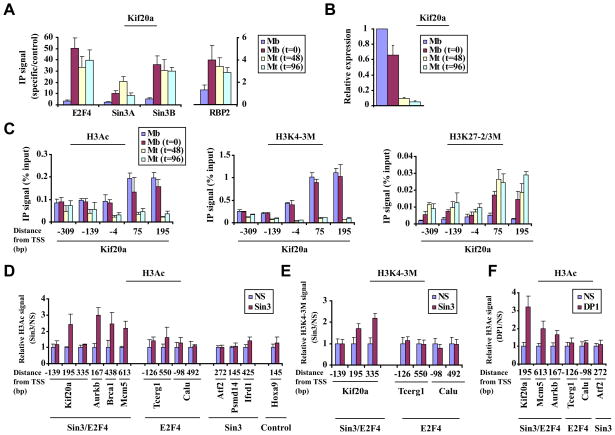
Figure 4. Coordinated removal of “active” chromatin marks by Sin3 and RBP2 leads to repression.
(A) Analysis of Sin3, E2F4, and RBP2 binding to a selected E2F4 target gene (Kif20a) during a differentiation time course as in Fig. 1A. Cycling myoblasts (Mb), arrested myoblasts (Mb, t=0), and myotubes after 48 or 96 hours after induction of differentiation (Mt, t=48 or t=96, fully differentiated myotubes) were examined. (B) Gene expression analysis using quantitative real time RT-PCR for a differentiation time course, as described in panel 4A. (C) Histone H3 acetylation (H3Ac, panel 1) Histone H3 lysine 4 tri-methylation (H3K4-3M, panel 2), and Histone H3 lysine 27 di-/tri-methylation (H3K27-2/3M, panel 3) levels were measured by qChIP during a differentiation time course as in panel 4A. Enrichment by IP was measured as a function of input signal. (D and E) Histograms depicting H3Ac (D) and H3K4 tri-methylation (E) levels, assessed by qChIP on selected genes in differentiated myotubes transfected with a non-specific control (NS) or Sin3A/Sin3B (Sin3) siRNA. See Fig. 3B for details. (F) H3Ac levels were measured after knock-down of DP1 as described in panels D and E. All panels, averages of at least 3 independent experiments are shown and error bars represent standard deviation.

