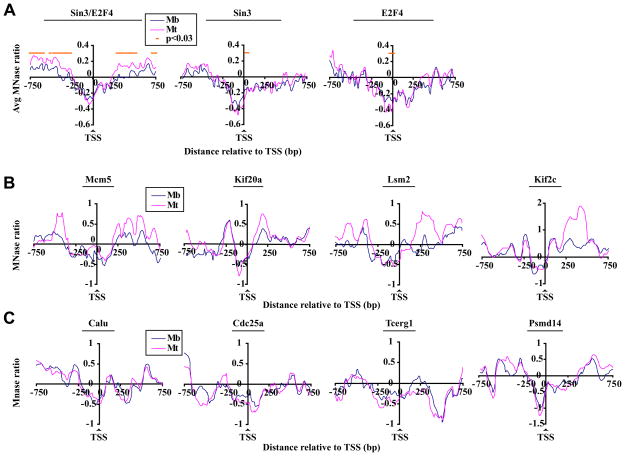
Figure 5. High resolution nucleosome density profiles of Sin3 target genes.
(A) Average nucleosome density profiles for genes bound by Sin3 and E2F4 (panel 1), Sin3 only (panel 2), and E2F4 only (panel 3) in myoblasts and differentiated myotubes deduced from our tiling arrays (see Fig. 2C). Genes were aligned relative to the TSS, and average MNase values per probe were calculated for each group. The results of at least two (myotubes) or three (myoblasts) experiments are shown. Mb, myoblasts; Mt, myotubes. (B) Nucleosome density profiles for individual genes bound by Sin3 and E2F4 in myoblasts and myotubes. MNase ratio is given by the moving average (window size 140 basepairs, step size 5 probes). (C) Genes bound by E2F4 only (panel 1–3) or a gene bound by Sin3 only (Psmd14, panel 4) were analyzed as described in panel B.

