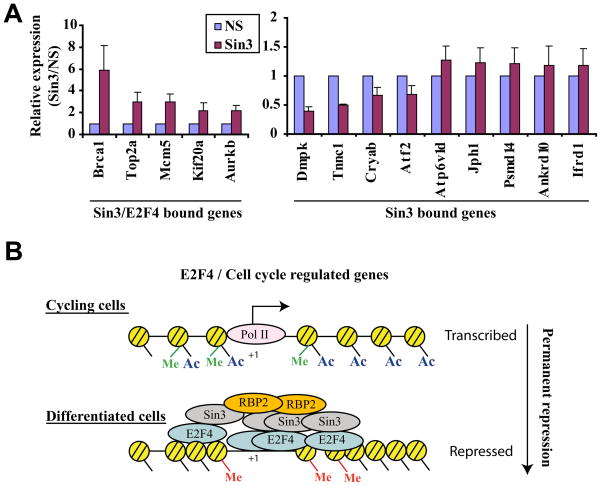
Figure 7. Expression of Sin3 target genes after knock-down of Sin3.
(A) Gene expression analysis using quantitative real time RT-PCR of selected genes after ablation of Sin3. Myotubes were transfected 48 h after induction of differentiation and were isolated 96 after transfection. Expression levels of selected genes in Sin3 siRNA-transfected cells were compared to non-specific control (NS) transfected cells. The average of three independent experiments is shown. Error bars represent standard deviation. (B) Model detailing Sin3 function in differentiated muscle cells on a subset of E2F4 target genes. Me: methylation of H3K4 (green) and H3K27 (red); Ac: acetylation. See text for details.

