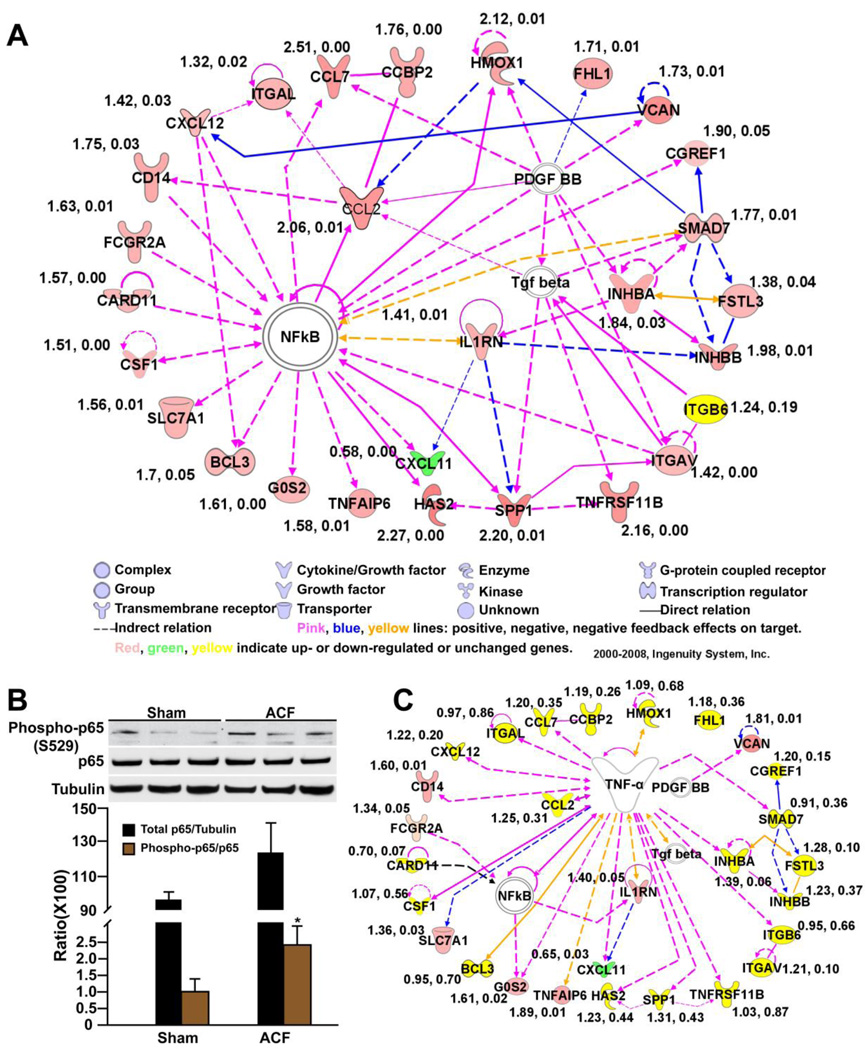
Figure 2. IPA analysis of differentially expressed genes in 24 hour ACF (see Table 2).
(A) IPA network of interactive genes involved in inflammation and immune response (P < 10−56). Connecting line(s) represent known biological relation between genes. Fold-changes and P-value derived from qRT-PCR are listed beside each gene. (B) Western blot of phospho- and total NF-κB p65 in ACF vs. sham. Tubulin loading control. *P < 0.05 vs. sham. (C) IPA analysis of the interaction between TNF-α and the identified gene network in (A). Effect of TNF-α neutralization on each gene was determined by qRT-PCR (fold-change and P-value listed beside each gene).

