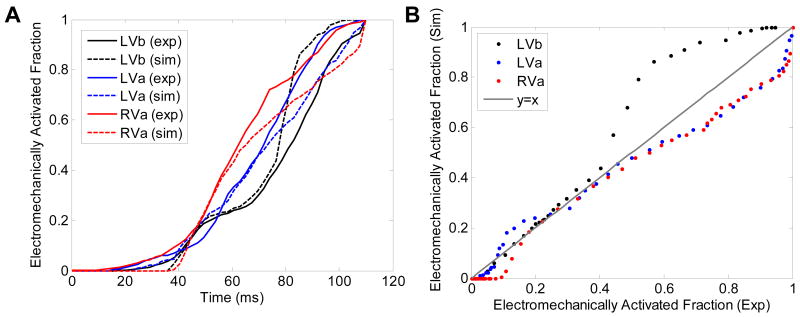
Figure 4.
Comparisons between experiments and simulations. A: Fraction of the myocardium in the echocardiographic view that underwent EW, plotted as a function of time, in experiments and simulations. B: Electromechanically activated myocardial fraction in the echocardiographic view in simulations, plotted as a function of the same in experiments.

