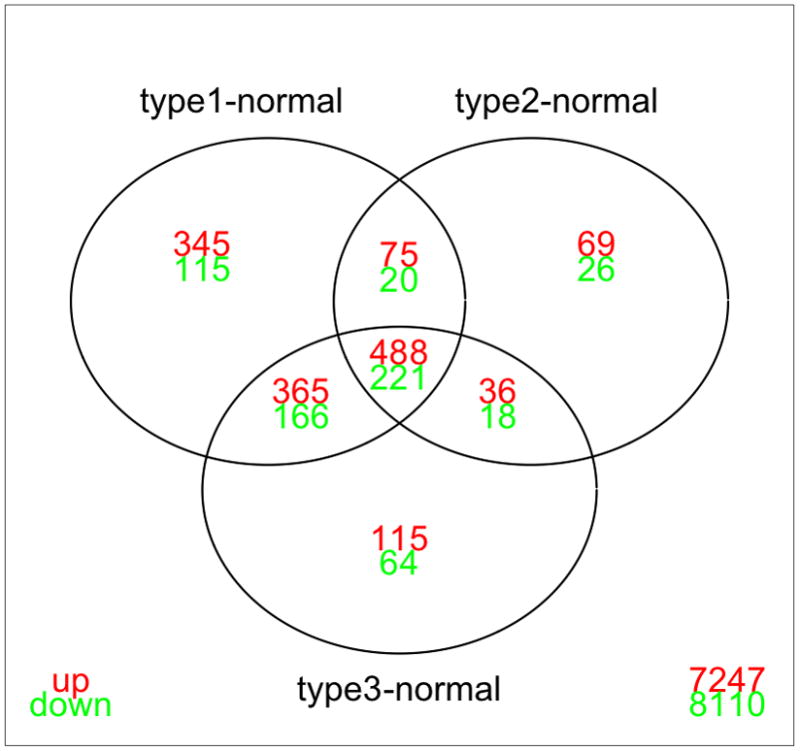
Figure 1.

Venn Diagram demonstrating the distribution of probes that are significantly different between gastric cancer subtypes and normal stomach. Although there is a large overlap between differentially expressed genes in each subgroup comparison versus normal, a large number of genes uniquely differentiate each individual gastric cancer subtype and normal stomach. Analysis is done using limma (with fold-change cut-off 2, and FDR=0.01; values for multiple probe values for the same gene were averaged). Type 1 = proximal non diffuse, type 2 = diffuse, and type 3 = distal non-diffuse gastric cancer.
