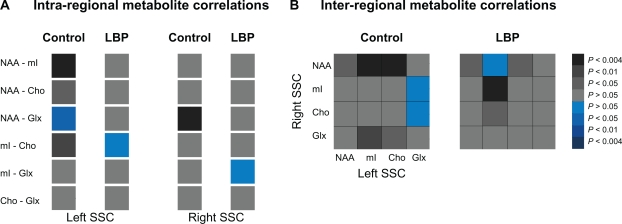
Figure 2.
Metabolite connectivity pattern within (A, intra-regional) and between (B, inter-regional) somatosensory cortices (SSCs) in controls (left panels) and chronic low back pain (LBP) patients (right panels). The correlation values (Pearson’s correlation coefficients) are presented as color gradients (grey-positive, blue-negative) and the side legend represent the corresponding P-values.
Abbreviations: NAA, N-acetylaspartate; mI, myo-inositol; Cho, choline; Glx, glutamate/glutamine.

