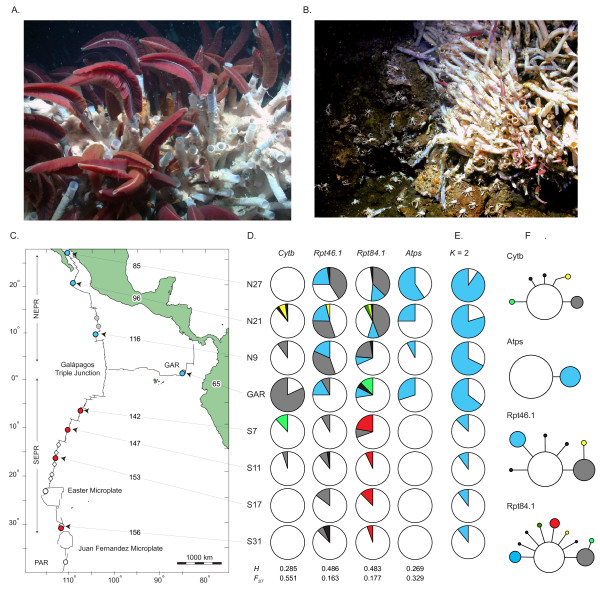
Figure 1.
Habitat instability and genetic diversity in R. pachyptila. (A) A healthy patch of tubeworms at the N27 locality. (B) An adjacent senescent patch on a rust-colored sulfide mound covered with numerous scavengers, the galatheid squat lobster Munidopsis subsquamosa. (C) Riftia pachyptila samples: blue and red dots indicate northern and southern sample locations; gray dots indicate active vents known to host R. pachyptila but not included in present analyses; white dots denote active vents that did not host substantial R. pachyptila colonies during the times of our expeditions; and white diamonds denote vents that did not support R. pachyptila colonies. Tectonic spreading rates are indicated along arrows for each location. (D) Allelic frequencies at four loci. Colors are coded to adjacent haplotype networks (black wedges are singletons). (E) Structure plots for the mean probability of assignment of individuals (Q values) to the northern cluster (blue) versus the southern cluster (white). (F) Haplotype networks for six genetic markers. Area of circle is proportional to the frequency of each haplotype, and straight lines denote single nucleotide differences.

