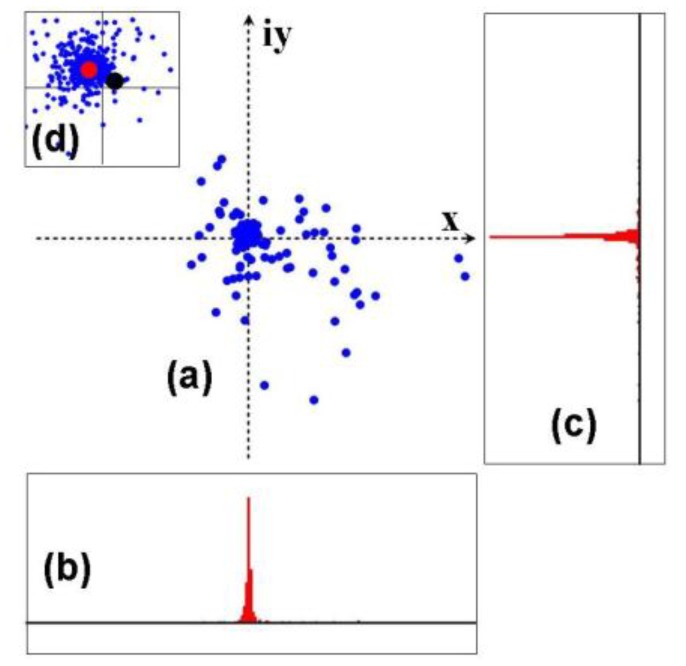
Fig. 2.

Complex-plane representation of the A-line data (a), their histogram on the real axis (b), their histogram on the imaginary axis (c), and the magnified version ( × 20) of the complex plane for the central area (d). The data are from the 162nd line of the raw OCT image in Fig. 1 (a).
