Fig. 9.

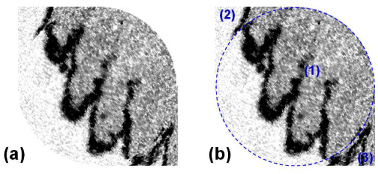
OCT en face image before cutting the corner areas out (a) and the scan circle area laid over the same image (b). The blue dotted circle depicts the circular scan area (1) and two corner areas [(2) and (3)].

OCT en face image before cutting the corner areas out (a) and the scan circle area laid over the same image (b). The blue dotted circle depicts the circular scan area (1) and two corner areas [(2) and (3)].