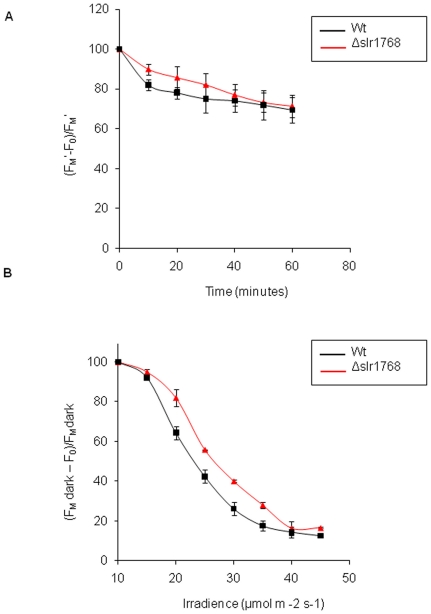
Figure 4. Photosynthetic performance of Δslr1768 cells in comparison to wild-type Synechocystis.
Graph A, maximum photochemical efficiency in the dark after continuous illumination of 1000 µmol m−2 s−1, quantifying levels of photoinhibition. Graph B, actual quantum yield of photosystem II photochemistry in the light under increasing actinic irradiances. Cells were grown in high light (see Materials and Methods for details).

