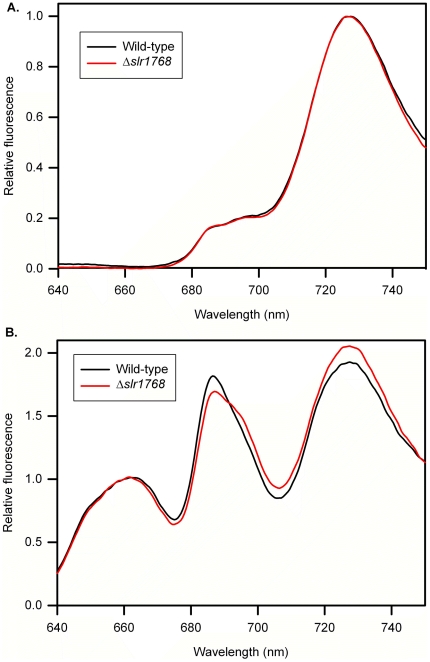
Figure 5. Fluorescence emission spectra measured at 77K.
Spectra recorded for frozen suspensions of cells grown in high light (see Materials and Methods for details). Spectra are means from 3 separate samples, normalised at 725 nm (in A) or 665 nm (in B). A: excitation at 435 nm, mainly exciting chlorophyll a. B: excitation at 600 nm, mainly exciting phycocyanin.

