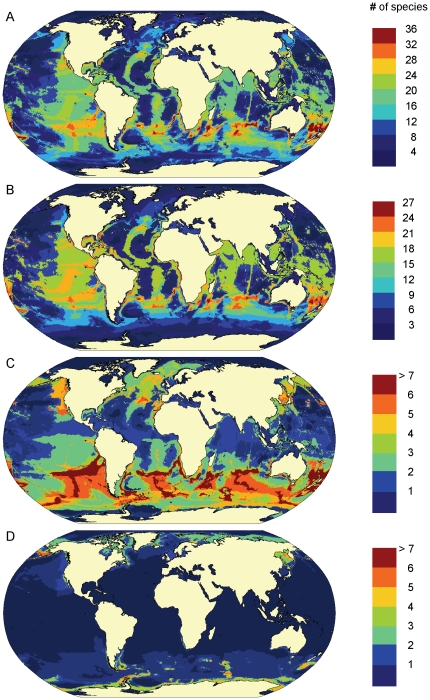
Figure 1. Predicted patterns of marine mammal species richness.
A. All species (n = 115), B. Odontocetes (n = 69), C. Mysticetes (n = 14), D. Pinnipeds (n = 32). Colors indicate the number of species predicted to occur in each 0.5°x0.5° grid cell from a relative environmental suitability (RES) model, using environmental data from 1990–1999, and assuming a presence threshold of RES>0.6.

