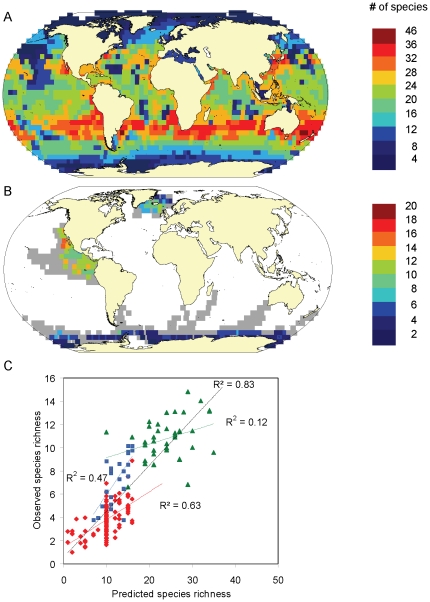
Figure 4. Validation with empirically observed marine mammal occurrences (5°x5° cells, 1990–1999).
A. Predicted species richness of all cetaceans (RES presence threshold >0.6), B. Observed cetacean species richness per standardized sample of 50 sightings (grey cells have been covered by surveys but had insufficient effort for analysis), C. Relationship between observed and predicted species richness in the Antarctic (red), North Atlantic (blue) and Eastern Tropical Pacific (green) and across all three surveys (black). Data points correspond to individual 5°grid cells, regression lines to best linear fits, r2 values were corrected for spatial autocorrelation.

