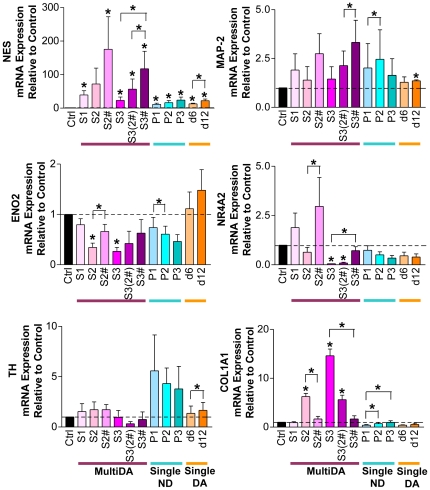
Figure 2. Increased neural gene expression in hMSC cultures undergoing in vitro neuronal and dopaminergic neuronal differentiation.
Real-time RT-PCR results from the MultiDA (purple shades), SingleND (blue shades), and SingleDA (orange shades) [32] methods. Neuronal genes: NES, MAP-2 and ENO2. Dopaminergic neuronal genes: NR4A2 and TH. Mesodermal gene: COL1A1. Results are depicted as mean fold change in mRNA expression + SEM relative to control undifferentiated hMSC cultures, with baseline set at 1.0 (n = 3). * p<0.05 compared with the control, unless indicated by brackets. Ctrl, control undifferentiated hMSCs; S, stage; #, growth factors from S1 included; P, passage; d, day.

