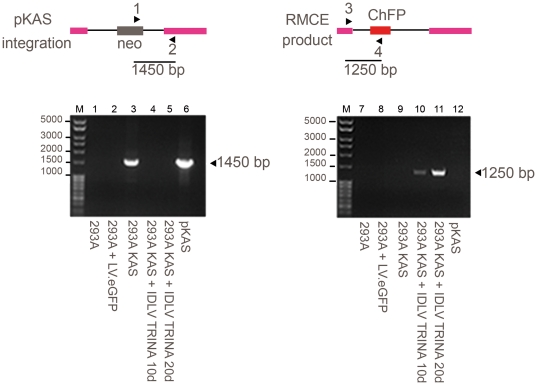
Figure 4. PCR analysis of genomic DNA isolated to verify RMCE reaction.
PCR analysis of genomic DNA extracted from the HEK293A cells (lane 1 and 7), or transfected with pKAS (293AKAS) (lanes 2 to 5 and 8 to 11). Cells were transduced with control virus IDLV.CMVeGFP (lanes 2 and 8), IDLV.TRINA (lanes 4, 5, 10 and 11), or non-transduced (lanes 3 and 9). Positive control is DNA from pKAS (lanes 6 and 12). The 1250 bp band is indicative of RMCE between KAS and TRINA cassettes and the 1450 bp corresponds to integrated pKAS band. IDLV.TRINA/10 and IDLV.TRINA/20 correspond to DNA obtained after from cultures selected during10 and 20 days with hygromycin respectively. The sizes of the DNA fragments in the marker line M are indicated.

