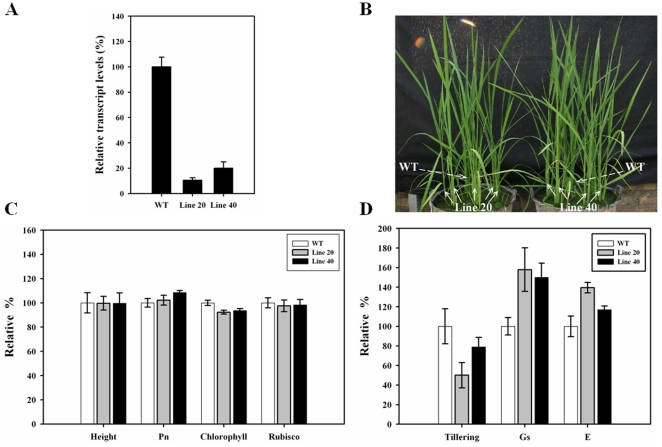
Figure 1. The phenotypes of OsNOA1-silenced lines 20 and 40 under normal natural growth conditions.
(A) Transcriptional expression of OsNOA1 (n = 6); (B) Images of rice growth; (C) Relative height (n = 24), photosynthesis rates (Pn) (n = 16), chlorophyll (n = 3) and Rubisco (n = 3) in the silenced and WT plants; (D) Relative tillering (n = 24), stomatal conductance (Gs) (n = 16) and transpiration rates (E) (n = 16). The second leaf from the top was sampled for the analyses. The data are the means ±SD of n replicates and representative of at least three independent experiments.

