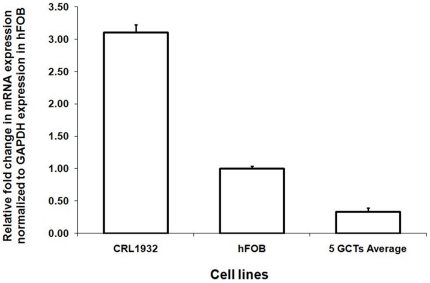
Figure 1. Relative mRNA expression of PTHrP based on real-time RT-PCR.
The average expression of PTHrP in five different GCT stromal cells, CRL1932 and hFOB cells (controls). The ΔΔCT method was used to calculate the real-time RT-PCR fold change using GAPDH mRNA for normalization, and all changes in expression are relative to the control without any treatment. Triplicate independent real-time PCR experiments were performed.

