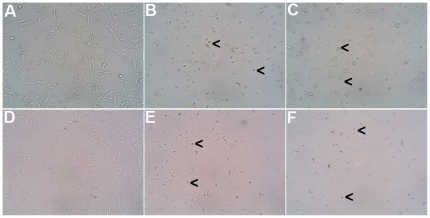
Figure 2. Cell morphology in the presence or absence of anti-PTHrP treatment.
Cell morphology of renal cell adenocarcinoma CRL1932 (A, B, C) and GCT stromal cells (D, E, F) in the presence of IgG control (A, D), the apoptotic agent etoposide (B, E) and anti-PTHrP antiserum (C, F). Representative pictures were taken with light microscope at magnification ×200. Black arrows indicate examples of cells undergoing apoptosis.

