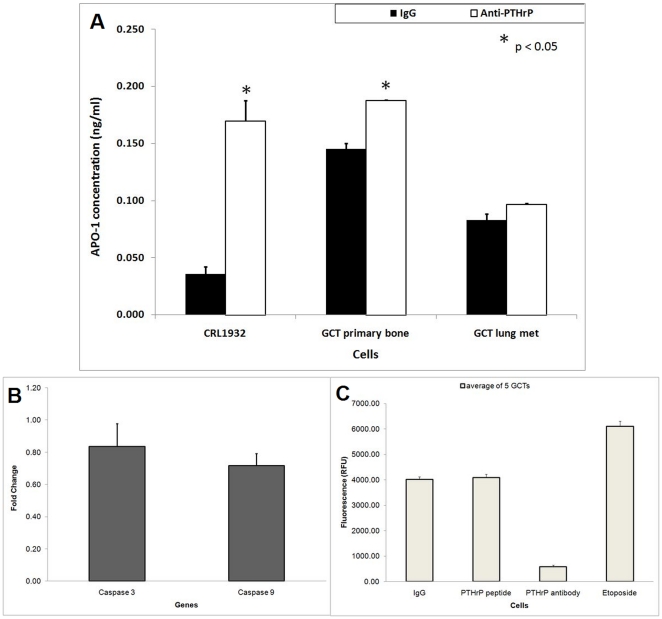
Figure 4. The effect of PTHrP on the expression of death markers.
A) The effect of anti-PTHrP antibodies on the level of APO-1 concentration in CRL1932 and GCT bone and lung metastasis stromal cells. Filtered and concentrated conditioned media from cell cultures treated with and without anti-PTHrP antibodies were analyzed using the APO-1 ELISA kit as per optimization in our lab. Results of the ELISA assay in triplicate are shown by error bars. The APO-1 concentration levels were normalized to the amount of total protein for each condition. *P<.05 is versus corresponding IgG control values. Statistical comparison by analysis of variance with post hoc Tukey tests. B) Relative mRNA expression of caspase-3 and -9 based on real-time RT-PCR in five different GCT stromal cells. The ΔΔCT method was used to calculate the real-time RT-PCR fold change using GAPDH mRNA for normalization, and all changes in expression are relative to the control without any treatment. Triplicate independent real-time PCR experiments were performed. C) Caspase-3/7 activity assay was performed on GCT cells under various treatments in 96 well plate format. Average results of the activity assay of five GCT cells in triplicate are shown by error bars.

