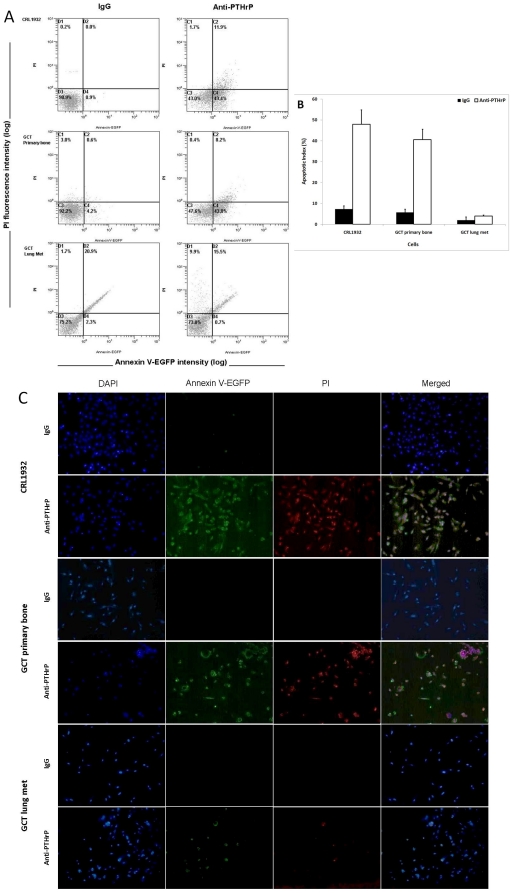
Figure 5. Apoptosis induced by the anti-PTHrP antibody immunotherapy.
A & B) CRL1932 and GCT stromal cells and GCT lung metastasis were starvation synchronized and treated with either anti-PTHrP antiserum or IgG for two days. All cells were gated, and apoptosis was determined by Annexin V-FITC and PI staining with flow cytometry. Numbers within quadrants represent percentages of live (lower left quadrant), early apoptotic (lower right quadrant), and late apoptotic or necrotic (top left and right quadrant) cells. A) Representative results from FACS analysis showed apoptotic/necrotic distribution of proliferating CRL1932, GCT stromal cells from primary bone and lung metastasis with either anti-PTHrP antiserum or IgG. B) The average apoptotic index showing only the early apoptosis measurement for CRL1932 and GCT stromal cells from primary bone and a lung metastasis. Values represent the means ± SEM of triplicate independent experiments. C) Under the same treatment conditions, cells were grown on cover slips and underwent fluorescent staining with DAPI, annexin V-EGFP and PI for morphological determination of apoptosis and necrosis. Representative pictures were taken with corresponding filters using a fluorescent microscope.

