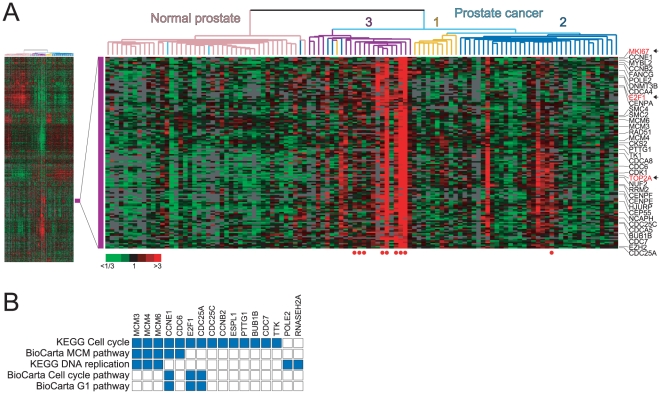
Figure 1. A proliferation signature cluster in prostate cancer.
(A) Unsupervised cluster analysis of prostate cancers (data set from ref. [19]) reveals molecular subtypes of prostate cancer (1, 2 and 3, labeled), and gene-expression features reflecting underlying biological processes. Left, thumbnail heatmap of the cluster analysis. Right, enlarged view of the “proliferation cluster”, with selected genes shown (MKI67, TOP2A and E2F1 in red text, marked by arrow). Red and green expression levels reflect high and low values, respectively (see key). Red filled circles (below) identify lymph node metastases. (B) Overlap matrix of proliferation cluster genes (N = 94) with canonical pathway (CP) gene sets identifies top gene set matches (all significant, P<0.001) all relating to cell-cycle/proliferation. Solid blue fill indicates overlapping membership between proliferation cluster and queried gene sets.

